Integrations
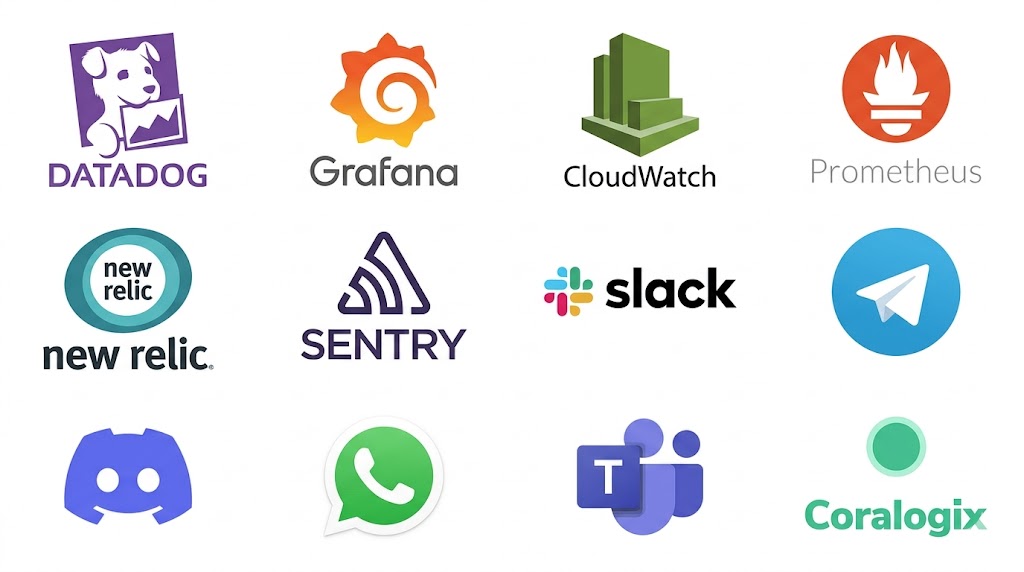
Connects to Your Entire Stack
SeerOps provides autonomous incident management for the modern enterprise. Six AI agents that predict, prevent, and resolve — with institutional memory that gets smarter every time.
Powering the world's most resilient operations
Everything you need to observe, manage, and scale complex infrastructure without the cognitive load.
Unified telemetry across logs, metrics, and traces. 10 monitoring integrations. Real-time clustering with Gemini embeddings.
Autonomous incident response via runbook automation. Atlas agent executes fixes, Sentinel verifies. Zero human intervention needed.
Predict performance bottlenecks and resource exhaustion before they hit production. Pattern-based predictions with confidence scores.
Each agent has a name and a mission. Together they form your autonomous ops team.
Scouts ahead through the noise. Suppresses known issues and auto-resolves recurring patterns.
The wise one. Clusters alerts, finds root cause with AI, maps blast radius.
Carries the weight. Executes automated remediation via your existing webhook tools.
The watchful guard. Checks 90s after every fix if the issue recurred.
Echoes back what worked. Remembers every fix and surfaces them next time.
Watches for zero-day threats. Scans dependencies against CVE databases 24/7.
Deploy SeerOps in 5 minutes. Our engine maps dependencies, establishes baselines, and remembers every resolution.
Everything the modern ops team needs, built on sovereign AI.
Know who's on call. Auto-route incidents to the right responder.
Map services, teams, and dependencies. Understand blast radius.
AI generates postmortems with timeline, root cause, action items.
Public status page for customers. Auto-updates as incidents resolve.
Ask about incidents in plain English. Get data-backed answers.
AI recommends which alerts to suppress. Cut noise by 80%.
AI predicts incidents before they happen from historical patterns.
Correlates incidents with recent deploys. See which change broke things.
Join 500+ enterprises who have automated their operations. Reduce noise by 90% and resolve issues 60% faster.
Enterprise grade. Secure. Private.